Figure 1
Download original image
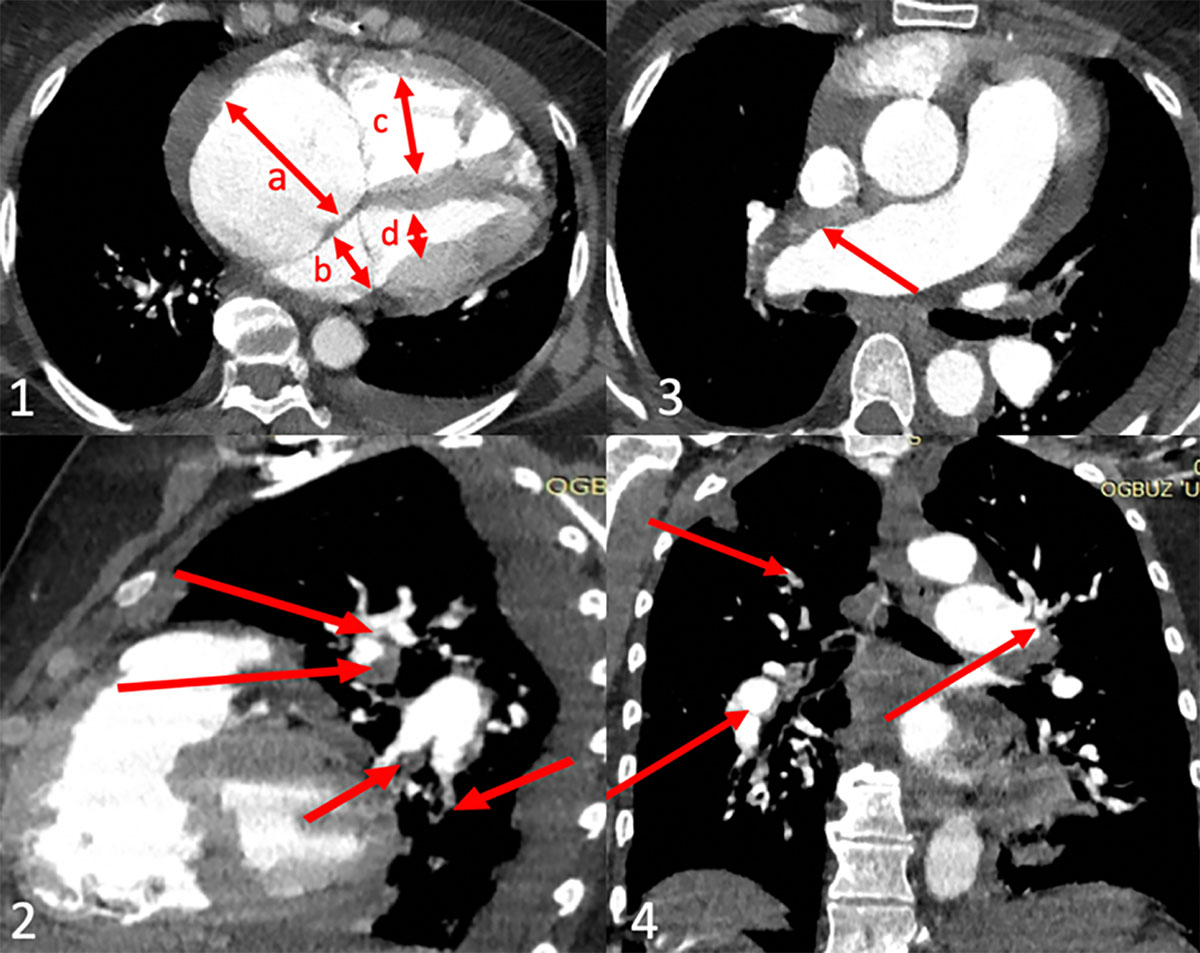
CT-angiogram: 1 – axial view shows right atrium (a) and right ventricle (c) enlargement compare to left atrium (b) and left ventricle (d); 2 – sagittal view shows organized thrombi in lobar and segmental branches of left pulmonary artery (red arrows); 3 – axial view shows proximal organized thrombus in right main pulmonary artery (red arrow); 4 – coronal view shows organized thrombi in right and left lobar pulmonary artery branches (red arrows).
Current usage metrics show cumulative count of Article Views (full-text article views including HTML views, PDF and ePub downloads, according to the available data) and Abstracts Views on Vision4Press platform.
Data correspond to usage on the plateform after 2015. The current usage metrics is available 48-96 hours after online publication and is updated daily on week days.
Initial download of the metrics may take a while.