Open Access
Figure 2
Download original image
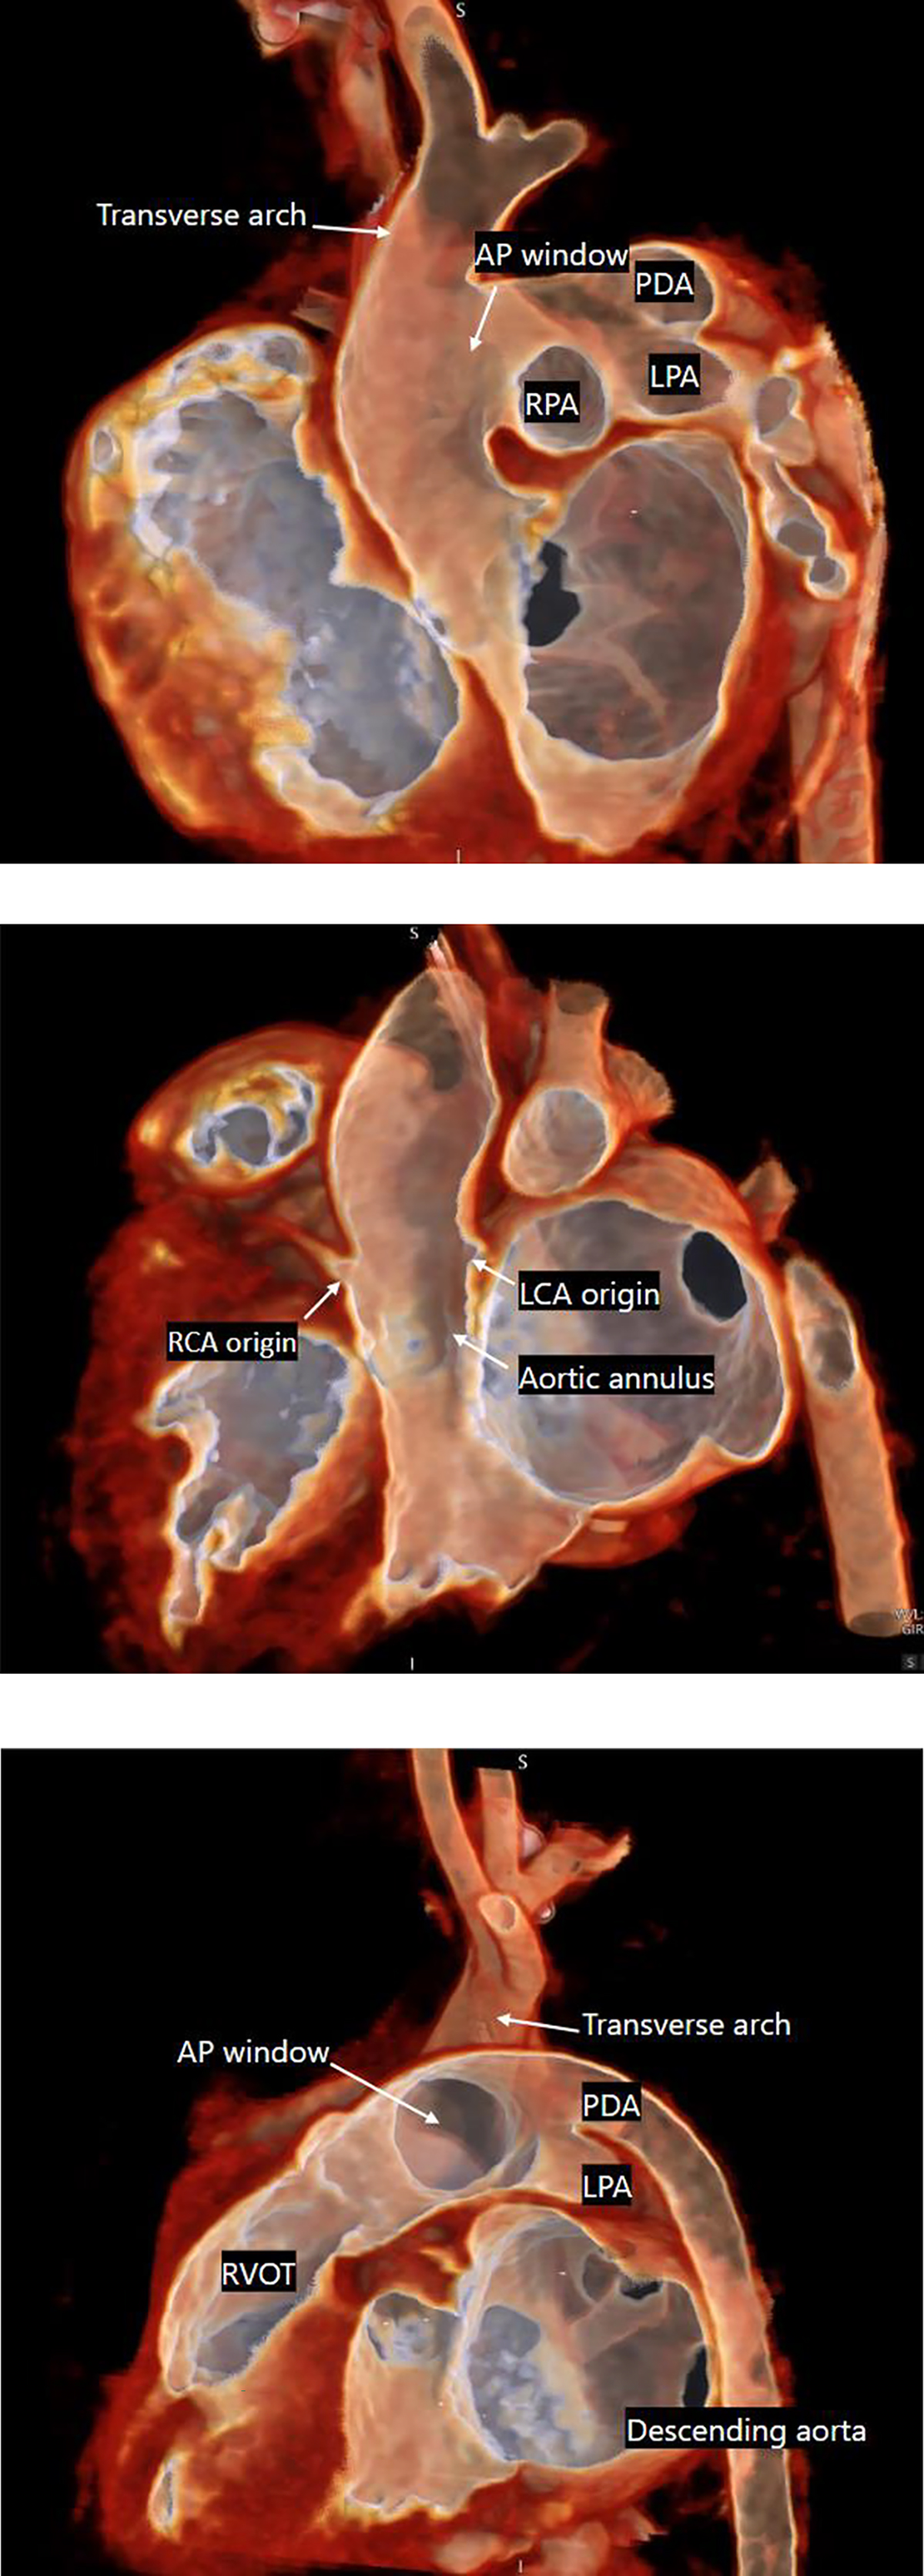
A. CTA image large APW in close proximity to transverse arch. B. CTA image identifying high origins of coronary arteries, above the level of the annulus. C. CTA image revealing distance between descending aorta and transverse aorta.
Current usage metrics show cumulative count of Article Views (full-text article views including HTML views, PDF and ePub downloads, according to the available data) and Abstracts Views on Vision4Press platform.
Data correspond to usage on the plateform after 2015. The current usage metrics is available 48-96 hours after online publication and is updated daily on week days.
Initial download of the metrics may take a while.