


| Issue |
J Extra Corpor Technol
Volume 58, Number 2, June 2026
|
|
|---|---|---|
| Page(s) | 128 - 138 | |
| DOI | https://doi.org/10.1051/ject/2025071 | |
| Published online | 19 June 2026 | |
Original Article
Estimation of hemoglobin concentration at the initiation of cardiopulmonary bypass using support vector regression
1
Department of Medical Equipment Engineering, Clinical and Educational Collaboration Unit, Faculty of Medical Sciences, Fujita Health University, Toyoake, Aichi, Japan
2
Department of Biomedical Engineering, Graduate School of Medical Science, Fujita Health University, Toyoake, Aichi, Japan
3
Fundamental Education Department, Faculty of Medical Sciences, Fujita Health University, Toyoake, Aichi, Japan
4
Department of Clinical Engineering, Clinical and Educational Collaboration Unit, Faculty of Medical Sciences, Fujita Health University, Toyoake, Aichi, Japan
* Corresponding author: This email address is being protected from spambots. You need JavaScript enabled to view it.
Received:
5
August
2025
Accepted:
4
December
2025
Abstract
Background: Hemodilution during cardiopulmonary bypass (CPB) is a standard perfusion strategy used to reduce blood viscosity and enhance microcirculatory flow. The hemodilution rate, expressed as hemoglobin (Hb) concentration, is a key control index in CPB and is currently estimated from total blood volume (TBV). The objective of this study was to propose a novel formula to accurately predict Hb concentration at the initiation of CPB (HbCPB) by incorporating circulating blood volume, laboratory data, physical measurements, and patient history. Methods: We retrospectively analyzed 577 adult patients who underwent elective CPB at Fujita Health University Hospital from January 2016 to December 2020. Thirty-six preoperative variables – including demographics, laboratory data, circuit parameters, and indices such as TBV and ideal weight – were standardized. Categorical variables underwent one-hot encoding. We compared generalized linear models (GLM), support vector regression (SVR), and multilayer perceptron (MLP). Model performance was evaluated using the coefficient of determination (R2), mean squared error (MSE), and Bland–Altman analysis (bias and 95% limits of agreement [LoA]). Predictions from two conventional TBV-based formulas were used as benchmarks. Results: Of 993 screened cases, 577 met inclusion criteria (447 males, mean age 66.8 ± 11.7 years; 130 females, 69.5 ± 10.6 years). SVR on standardized predictors achieved the highest accuracy (R2 = 0.498, MSE = 0.517), outperforming GLM (R2 = 0.429, MSE = 0.797) and MLP (R2 = 0.332, MSE = 0.669). Conventional formulas showed lower performance (R2 = 0.325, MSE ≥ 1.48). Bland–Altman analysis for SVR demonstrated minimal bias (–0.0028 g/dL) and narrower LoA (–1.42 to 1.41 g/dL) than conventional methods (bias –1.33 g/dL; LoA –3.49 to 0.83 g/dL). Conclusion: These findings suggest that an SVR-based model improves prediction of HbCPB over conventional approaches, supporting optimized transfusion management and reduced hemodilution-related risks.
Key words: Hemoglobin / Support vector regression / Cardiopulmonary bypass / Machine learning / Hemodilution
These two authors contributed equally to this work.
© The Author(s), published by EDP Sciences, 2026
 This is an Open Access article distributed under the terms of the Creative Commons Attribution License (https://creativecommons.org/licenses/by/4.0), which permits unrestricted use, distribution, and reproduction in any medium, provided the original work is properly cited.
Introduction
Japan’s population is aging rapidly, and the proportion of elderly patients undergoing cardiac surgery with cardiopulmonary bypass (CPB) has steadily increased over the past decade [1–4]. As this trend is expected to continue, developing appropriate CPB technologies for older patients has become imperative. Hemodilution during CPB is a standard perfusion strategy used to reduce blood viscosity and enhance microcirculatory flow [5]. However, anemia resulting from hemodilution may cause ischemic organ injury, increase mortality, and elevate stroke risk [6–8]. Current guidelines recommend maintaining hematocrit (Ht) levels ≥ 21% and/or hemoglobin (Hb) concentrations ≥ 7.0 g/dL during CPB to minimize hemodilution-related complications [9–11]. To assess the hemodilution rate, total blood volume (TBV) is estimated using body weight in kilograms (kg). TBV estimates are typically set at 70 mL/kg for American adult males, 65 mL/kg for females [12, 13], and 80 mL/kg for Japanese adults [14]. This method is commonly applied to all adults, regardless of age. However, several studies have shown discrepancies between predicted post-dilution Ht or Hb values and actual Hb concentrations at the initiation of CPB (HbCPB) [15–17]. Revised formulas incorporating sex and age have been proposed to improve TBV estimates [18]. Nonetheless, these methods often lack applicability to older patients, as they do not adequately account for age-related TBV decline [19].
This study aims to develop and propose a novel formula to predict  more accurately by incorporating TBV, laboratory data, physical measurements, and clinical history.
Materials and methods
Clinical data
This study analyzed data that were prepared to register in the Perfusion Database maintained by the Japanese Society of Extra-Corporeal Technology in Medicine (JaSECT) for patients who underwent cardiac surgery with CPB at Fujita Health University Hospital between January 1, 2016, and December 31, 2020. Only elective cases were included. Patients with congenital heart disease or those who underwent repeat surgeries were excluded to avoid duplicate entries, particularly in preoperative background data. Additionally, cases involving blood priming or with hemoglobin (Hb) concentrations below 7 g/dL at CPB initiation were excluded. Details of the data cleaning process are shown in Figure 1. The JaSECT Perfusion Database collects data across six domains: patient demographics; circuit and priming fluid details; CPB parameters; fluid volume input and output management; laboratory data and outcomes. These domains consist of 84 multiple-choice items and 159 numeric variables, totaling 243 parameters [20]. From in-hospital data for this database, we extracted 35 pre-CPB parameters along with HbCPB for model development, as described in the following section.
Demographic and clinical variables: sex; age at surgery; surgical procedure; height; weight; left ventricular ejection fraction; and risk factors, including congestive heart failure, chronic respiratory disease, smoking history, diabetes mellitus, arrhythmia, hypertension, dyslipidemia, cardiovascular or extracardiac vascular disease, cerebrovascular disease, renal dysfunction, and chronic dialysis.
Blood laboratory data obtained by the time of admission to the operating room: glucose (mg/dL); potassium (mEq/L); lactate (mg/dL); creatinine (mg/dL); Hb (g/dL); results of arterial blood gas analysis (pH, PaO2(mmHg), PaCO2(mmHg), HCO3− (mEq/L)) and activated clotting time (sec)
Variables described the CPB circuit configuration: biocompatible coating part; planned priming volume (Static circuit volume); and priming fluid composition.
Variables obtained from formulas using collected data: ideal body weight; TBV; body mass index (BMI); obesity classification; and body surface area (BSA).
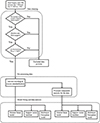 |
Figure 1 Analysis flowchart. |
BMI, ideal body weight (BWi) [18], TBV [11] and BSA [21] were calculated as follows (Eqs. (1)–(4)): (1)
(1) (2)
(2) (3)
(3) (4)
(4)
where w is the body weight (kg) and h is the height (m).
Obesity was classified according to the Japanese Society for the Study of Obesity Guidelines [22] as follows: underweight (BMI < 18.5 kg/m2), normal weight (18.5 ≤ BMI < 25 kg/m2), obesity class I (25 ≤ BMI < 30 kg/m2), class II (30 ≤ BMI < 35 kg/m2), class III (35 ≤ BMI < 40 kg/m2), and class IV (BMI ≥ 40 kg/m2). Hematocrit (Ht) values measured before and at CPB initiation were converted to Hb concentrations using the equation: Ht ≈ 3 × Hb [23].
Analysis protocol
Preprocessing of eligible clinical data
The 35 parameters described in the previous section were considered candidate explanatory variables for estimating HbCPB. One-hot encoding was applied to 15 categorical variables (e.g., sex, type of surgery, and presence of comorbidities), and z-score standardization was applied to 20 continuous variables (e.g., laboratory data) [24, 25]. The interactions among variables, and between each variable and hemoglobin concentration, remain unknown. In general, including variables with low or no relevance to the target variable may impair the generalizability of a predictive model and lead to overfitting. It is therefore advisable to limit explanatory variables to those that carry significant information about the outcome [26]. However, this restriction may exclude potentially informative features. To address this, we prepared two datasets for analysis: the full standardized dataset and a dimensionally reduced dataset, described below.
Principal Component Analysis (PCA) [27] was applied to the standardized explanatory matrix X∈RN×P (where N is the number of subjects and P is the number of variables) to mitigate multicollinearity. Eigenvalue decomposition was performed on the covariance matrix  , and the smallest number of principal components K was selected such that the cumulative contribution of the eigenvalues
  exceeded 90%. Next, the principal component score matrix
 ![Mathematical equation: $ \mathbf{P}=\left[{\mathbf{t}}_1,\dots,{\mathbf{t}}_K,\right]=\enspace \mathbf{X}\left[{\mathbf{v}}_1,\dots,{\mathbf{v}}_K\right]\in {\mathbb{R}}^{N\times K}$](/articles/ject/full_html/2026/02/ject250087/ject250087-eq10.gif) was calculated using the principal component vector
was calculated using the principal component vector  . After PCA, P was used as the explanatory variable for the subsequent model training.
Linear model for predicting hemoglobin concentration at CPB initiation
Conventional methods for estimating HbCPB [17–19] are essentially linear models that incorporate a limited set of patient and circuit factors, such as priming volume. We first evaluated whether a linear approach would be adequate for our dataset. To do so, we fit a generalized linear model (GLM) using routinely available pre-CPB variables, including body size indices, laboratory values, and circuit settings. The GLM assumes that HbCPB varies in approximate proportion to changes in these inputs. Model performance was assessed using the coefficient of determination (R2) and mean squared error (MSE). The explicit GLM equation and estimation procedures are provided in Supplementary equation (s-i).
Nonlinear model for predicting hemoglobin concentration at CPB initiation
Because clinical data often contain nonlinear relationships and interactions that linear models may not capture, we also evaluated two standard nonlinear approaches: Support Vector Regression (SVR) and a Multilayer Perceptron (MLP).
SVR can model curved relationships between the inputs and HbCPB without the need to specify functional forms. We used a widely adopted SVR implementation and tuned its hyperparameters by cross-validation to reduce overfitting; further details are provided in the Supplementary equations S-ii, iii). The MLP is a simple neural-network model that learns patterns by stacking a small number of layers. We compared several compact architectures and training configurations and selected the model that performed best in cross-validation. Training details (architecture and stopping criteria) are summarized in the Supplementary equation S-iv [28–30].
For some analyses, we also used a compressed set of input variables derived from principal component analysis to reduce redundancy among predictors. We retained the smallest number of components that preserved approximately 90% of the total variance. Technical details are provided in Supplementary material S2.
Model training, validation, and reporting
For all models, we standardized inputs when appropriate, tuned model settings by cross-validation, and summarized performance using R2 and MSE. Because correlation-based indices do not measure exact agreement, we also evaluated agreement between predicted and measured HbCPB with Bland–Altman analysis (bias and 95% limits of agreement) (Supplementary material S5).
Software and reproducibility
Analyses were performed with commonly used, off-the-shelf software (e.g., MATLAB equivalents or open-source alternatives). Parameter settings and code snippets sufficient for reproduction are listed in the Supplementary material.
Evaluation of the proposed method
To evaluate the performance of the trained models, predictions on the validation and hold-out test sets were computed and compared against the reference values of HbCPB. As this is a regression task, three metrics were used to quantify prediction accuracy: MSE, mean absolute error, and the coefficient of determination (R2). In addition, Bland–Altman analysis was performed to further examine the agreement between predicted and measured hemoglobin concentrations. From this analysis, the mean difference (bias) and 95% limits of agreement (LoA), defined as ±1.96 times the standard deviation of the differences, were calculated.
To benchmark our method against conventional prediction models, the same clinical dataset was fitted using the standard hematocrit-based prediction formula [18], which is expressed as: (5)
(5)
where HtCPB is the hematocrit value under CPB, HtbeforeCPB is the hematocrit value before CPB, PV is Priming Volume. TBV was substituted from two approaches: equation (3) [19] and the following equation [18]: (6)
(6)
Estimated Hb concentrations based on equation (5) and their Bland–Altman statistics, mean difference, and 95% LoA, were compared with those obtained for our approach.
Results
Data from 577 patients, including 447 males (mean age 66.1 ± 11.8 years) and 130 females (mean age 69.5 ± 10.6 years), were included in the analysis. Subject characteristics are summarized in Table 1. In terms of obesity classification, 31 patients (5.4%) were underweight, 361 (62.6%) were standard weight, 146 (25.3%) were classified as obese class I, 33 (5.7%) as class II, 5 (0.8%) as class III, and 1 (0.2%) as class IV. The surgical procedures included coronary artery bypass grafting (CABG) in 149 patients (25.8%), valve surgery in 215 (37.3%), combined CABG and valve procedures in 67 (11.6%), combined CABG and other procedures in 27 (4.7%), aortic surgery in 91 (15.8%), and other procedures in 28 (4.8%). Regarding biopassive coating, it was absent in 2 patients (0.3%), applied to limited components in 34 (5.9%), applied to all components except the cannulae in 484 (84.0%), and applied tip-to-tip in 57 (9.8%). The main priming solution was bicarbonate Ringer’s in 540 patients (93.6%). Other solutions included saline in 17 (3.0%), lactated Ringer’s in 2 (0.3%), acetate Ringer’s in 3 (0.5%), starch or dextran in 3 (0.5%), and other crystalloid-only solutions in 12 (2.1%). A centrifugal pump was employed in all cases.
Clinical characteristics/Baseline clinical characteristics of the study population.
Figure 2 shows the scree plot of the principal components derived from PCA of the predictor matrix X∈RN×P, which comprises z-score standardized continuous variables and one-hot encoded categorical variables. From this plot, it was confirmed that 17 components were required to reach a cumulative explained variance of 90%. Figure 3 illustrates the five variables with the highest absolute loadings for each principal component. These results indicate that body weight was captured primarily by PC1, priming volume (static circuit volume) by PCs 5, 7, 9, and 11, and preoperative hemoglobin concentration by PCs 5, 8, 9, 12, 14, and 16. Table 2 presents the results of the generalized linear model fitted to the PCA-transformed predictors. The analysis revealed that intraoperative HbCPB was primarily determined by six principal components: PC1, PC2, PC5, PC8, PC12, and PC14.
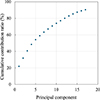 |
Figure 2 Cumulative explained variance. Principal components (PCs) are added sequentially from PC1 to PC17 (left to right); 90% cumulative explained variance is achieved with the first 17 PCs. |
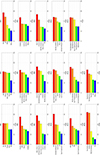 |
Figure 3 Weight of principal component analysis. |
Regression results of PCA components for predicting HbCPB.
Figure 4 shows the comparison between measured HbCPB and predicted values based on pre-CPB variables, while Table 3 summarizes model performance indices. For each scatter plot in Figure 4, the ordinary least-squares regression slopes and y-intercepts – where better estimation is reflected by a slope close to 1 and a y-intercept close to 0 – are displayed. The slopes and intercepts (panels a–e) are as follows: (a) slope = 1.00, intercept = 4.00 × 10⁻⁵; (b) slope = 1.22, intercept = −1.88; (c) slope = 0.92, intercept = 0.68; (d) slope = 0.44, intercept = 4.18; (e) slope = 0.48, intercept = 4.13. A GLM fitted to the standardized predictor matrix X∈RN×P achieved a coefficient of determination of  , adjusted
  , and MSEGLM = 0.797. However, multicollinearity in the input matrix was confirmed, resulting in a lack of full rank. Applying the same GLM to PCA-transformed predictors
  yielded
  (adjusted
  ) and MSEPCR = 0.808. SVR on X with optimized hyperparameters C = 2.279, γ = 16.81, and ε = 0.594 yielded
  and 10-fold CV MSESVR = 0.517, outperforming the GLM. When SVR was applied to XPCA with C = 1.662, γ = 14.28, and ε = 0.0084, performance decreased to
  = 0.39 and CV
  . The MLP model, tuned via nested 5-fold CV, selected one hidden-layer architecture of 4 neurons, with Resilient Backpropagation, a learning rate of 10−2, and early stopping tolerance of 10. On X, this configuration yielded
  = 0.332 ± 0.033 and MSEMLP = 0.669 ± 0.086. When applied to XPCA, the MLP achieved R2 = 0.352 ± 0.054 and MSE = 0.646 ± 0.068. The coefficients of determination from both MLP configurations were lower than those from SVR. Previously published HbCPB prediction formulas yielded R2 = 0.3225, MSE = 2.98 based on [19], and R2 = 0.3245, MSE = 1.48 based on [18], both substantially lower than SVR performance.
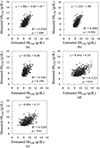 |
Figure 4 Correlation between measured HbCPB and estimated HbCPB: (a) HbCPB was estimated based on GLM, (b) that based on SVR, (c) that based on MLP, (d) that calculated based on reference [11], and (e) that based on equation (6). |
Comparison of prediction performance of hemoglobin prediction models.
Figure 5 displays the Bland–Altman analysis results. The bias between predicted and measured GLM values was –5 × 10⁻⁷ g/dL (95% CI: −0.0654 to 0.0654 g/dL), with 95% LoA of [–1.57 g/dL, 1.57 g/dL]. For SVR, the bias was –0.0028 g/dL (95% CI: −0.0619 to 0.0562 g/dL) with LoA of [–1.41 g/dL, 1.41 g/dL]. For MLP, the bias was –0.029 g/dL (95% CI: −0.0963 to 0.0375 g/dL), and LoA was [–1.63 g/dL, 1.57 g/dL]. In contrast, the conventional methods had a bias of –1.33 g/dL (95% CI: –1.41 to –1.24 g/dL) and LoA of [–3.49 g/dL, 0.831 g/dL] for the reference [11] and a bias of –0.64 g/dL (95% CI: –0.72 to –0.555 g/dL) and LoA of [–2.67 g/dL, 1.39 g/dL] for the equation (5), respectively. The 95% CI for bias did not include zero, indicating systematic error. In comparison, CIs from GLM, SVR, and MLP included zero, suggesting no statistically significant bias and the absence of systematic error. Biases between measured and predicted HbCPB from GLM, SVR, and MLP were not statistically significant (GLM: p = 1.000, d = −6.5 × 10⁻⁷; SVR: p = 0.926, d = −0.004; MLP: p = 0.389, d = −0.036). Conversely, biases from conventional models were confirmed (reference [11]: p < 0.01, d = −1.21; equation (5): p < 0.01, d = −0.617).
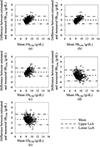 |
Figure 5 Bland–Altman analysis between measured HbCPB and estimated HbCPB: (a) estimated HbCPB was estimated based on GLM, (b) that based on SVR, (c) that based on MLP, (d) that calculated based on reference [11], and (e) that based on equation (6). |
Discussion
The GLM demonstrated moderate goodness-of-it despite the multicollinearity present in the input parameter matrix X∈RN×P. In contrast, implementing PCR resulted in reduced model performance across all evaluation metrics compared with the GLM. In PCR, dimensionality reduction is driven solely by the variance structure of the predictor matrix; therefore, principal components that explain substantial variance but have limited correlation with the response variable may still be retained as leading components. In this study, the first 17 principal components were adopted, collectively accounting for 90% cumulative explained variance in the predictor matrix. While this approach preserved most of the predictor information, it may have failed to isolate features most relevant to  . Furthermore, the first principal component accounted for more than 20% of the total variance, and PC1 and PC2 were primarily composed of weight, height, TBV, BSA, BMI, ideal weight, and obesity measures, supporting the interpretation that TBV-related factors remain central to HbCPB estimation. As a result, the PCR model may not have adequately captured the most predictive features of HbCPB, likely contributing to its reduced performance, as reflected in the lower coefficient of determination and higher MSE compared with the GLM using the full predictor set. Traditional predictors used to estimate HbCPB – including body weight, priming volume (static circuit volume), and preoperative Hb concentration – were embedded within the principal components retained by PCR and were selected as input features for both the SVR and MLP models. Nevertheless, several of the principal components used in HbCPB prediction did not primarily reflect these conventional parameters. Therefore, HbCPB cannot be fully explained by body weight, priming volume, and preoperative Hb concentration alone, as suggested by conventional approaches. At the same time, while models using PCs 1–17 showed better performance than the conventional formula, we cannot presently ascribe the improvement to specific components without dedicated ablation or feature-contribution analyses. These findings highlight the influence of additional confounding variables, including age and comorbidities.
Although model development and training require computational resources (workstation- or cloud-based), inference is lightweight and can be executed on common devices (e.g., a standard laptop or smartphone) with low latency and no specialized hardware. This enables point-of-care use in the operating room as a simple calculator or as a module integrated into existing perfusion workflows. Accordingly, the trained model can be delivered either (i) within the EHR as a point-of-care calculator or clinical decision support widget that auto-populates inputs from routinely collected pre-CPB data, or (ii) on perfusion hardware (e.g., as a vendor plug-in) to present predictions alongside pump parameters. After deployment, the model can operate offline, with input variables populated automatically from routine pre-CPB data, minimizing manual entry and cognitive load.
Among the nonlinear models, SVR demonstrated a higher coefficient of determination and lower MSE compared with both the GLM and PCR, indicating that SVR had superior predictive power. In contrast, applying PCA prior to SVR led to a decreased coefficient of determination, likely due to the exclusion of  -related features during the PCA process, as these were among the bottom 10% of principal components that were subsequently discarded. The MLP model, incorporating Levenberg–Marquardt–based parameter optimization and early stopping, achieved stable training. When applied to the standardized predictor matrix, MLP showed slightly lower performance than SVR but still achieved a moderate goodness-of-fit. Overall, SVR and MLP, which perform nonlinear function estimation and embed variable selection within the model, outperformed linear models, including conventional approaches, in predicting outcomes from high-dimensional medical data.
Although the best-performing method yielded a modest R2, agreement relevant to bedside use is better captured by Bland–Altman analysis [31, 32]: the new methods demonstrated minimal bias and narrower limits of agreement than the conventional formulas (Figure 5), indicating improved agreement despite a moderate R2 compared with previous methods. Finally, while models using multiple principal components outperformed the conventional formula, we cannot presently ascribe the improvement to specific components without dedicated ablation or feature-contribution analyses; this is noted as a limitation and will be addressed in future work.
Model development and training require computational resources; these activities can be conducted cost-effectively on a workstation or in the cloud using open-source machine-learning frameworks. After training, inference is lightweight, runs on commodity devices without accelerators, and can be embedded in existing EHR or perfusion-system workflows with minimal latency. From a clinical perspective, more accurate prediction of HbCPB at CPB initiation supports optimized transfusion strategies – reducing the likelihood of both under- and over-transfusion – and may help lower hemodilution-related risks while standardizing practice across teams. We therefore view the cost–benefit balance as favorable, while acknowledging that prospective evaluation of clinical outcomes and a formal cost-effectiveness analysis are warranted in future work.
Limitations
While the proposed models using PCs 1–17 outperformed the conventional formula, we cannot, at present, attribute this improvement to specific principal components without dedicated ablation or feature-contribution analyses. We acknowledge this as a limitation and plan to investigate the contribution of individual components and underlying variables in future work.
Although inference is feasible on standard devices, clinical integration remains ongoing. Both EHR-based and device-based (perfusion console) deployments are feasible, but practical adoption will require: (A) interoperability with hospital systems and/or perfusion consoles, (B) a user interface suited to intraoperative workflow, (C) prospective validation with monitoring for model drift, and (D) security and access control consistent with institutional policies. We plan to evaluate these aspects and conduct prospective usability and safety assessments prior to routine operating-room adoption.
Funding
The authors received no funding to complete this research.
Conflicts of interest
The authors declare no conflict of interest.
Data availability statement
Data available upon request from the corresponding author.
Author contribution statement
H. H. contributed to the conceptualization and design of the study, performed data analysis, drafted the initial manuscript, and participated in the review and revision of the final version. S. T. conducted statistical analysis, contributed to data interpretation, and assisted in drafting the manuscript. T.K. participated in data analysis and provided a critical review of the manuscript. M. H. contributed to the study’s conceptualization and design, provided overall supervision, and critically reviewed and revised the manuscript. All authors read and approved the final manuscript.
Ethics approval
This study was approved by the Ethics Review Committee of Fujita Health University (Approval No. HM21-381).
Supplementary material
S1. Generalized Linear Model (GLM).
S2. Support Vector Regression (SVR).
S3. Multilayer Perceptron (MLP).
S4. Dimensionality Reduction via PCA.
S5. Cross-validation, Metrics, and Comparative Baselines.
Access Supplementary MaterialAcknowledgments
The authors express their sincere gratitude to Tomoaki Yamashiro, Yusuke Nakamura, and the Clinical Engineering Department staff at Fujita Health University Hospital for their meticulous efforts in data collection.
References
- Hirata Y, Hirahara N, Murakami A, Motomura N, Miyata H, Takamoto S. Current status of cardiovascular surgery in Japan: analysis of data from Japan cardiovascular surgery database in 2015, 2016. 1. Congenital heart surgery. Jpn J Cardiovasc Surg. 2019;48(1):1–5 (in Japanese). [Google Scholar]
- Abe T, Nakano K, Hirahara N, Motomura N, Miyata H, Takamoto S, Current status of cardiovascular surgery in Japan: analysis of data from Japan cardiovascular surgery database in 2015, 2016. 3-valvular heart surgery. Jpn J Cardiovasc Surg. 2019;48(1):11–7 (in Japanese). [Google Scholar]
- Shimizu H, Hirahara N, Motomura N, Miyata H, Takamoto S. Current status of cardiovascular surgery in Japan: analysis of data from Japan cardiovascular surgery database in 2015, 2016. 4-Thoracic aortic surgery. Jpn J Cardiovasc Surg. 2019;48(1):18–24 (in Japanese). [Google Scholar]
- Saito A, Hirahara N, Motomura N, Miyata H, Takamoto S. Current status of cardiovascular surgery in Japan: analysis of data from Japan cardiovascular surgery database in 2015, 2016. 2. Isolated coronary artery bypass surgery. Jpn J Cardiovasc Surg. 2019; 48(1): 6–10 (in Japanese). [Google Scholar]
- Taniguchi FP, Martins AS. Hemodilution, kidney dysfunction and cardiac surgery. Einstein (Sao Paulo). 2009;7(1 Pt 1):103–107. [Google Scholar]
- Ranucci M, Conti D, Castelvecchio S, et al. Hematocrit on cardiopulmonary bypass and outcome after coronary surgery in nontransfused patients. Ann Thorac Surg. 2010;89(1):11–17. [CrossRef] [PubMed] [Google Scholar]
- Karkouti K, Djaiani G, Borger MA, et al. Low hematocrit during cardiopulmonary bypass is associated with increased risk of perioperative stroke in cardiac surgery. Ann Thorac Surg. 2005;80(4):1381–1387. [CrossRef] [PubMed] [Google Scholar]
- Tsui AKY, Dattani ND, Marsden PA, et al. Reassessing the risk of hemodilutional anemia: Some new pieces to an old puzzle. Can J Anaesth. 2010;57(8):779–791. [Google Scholar]
- Boer C, Meesters MI, Milojevic M et al. 2017 EACTS/EACTA guidelines on patient blood management for adult cardiac surgery. J Cardiothorac Vasc Anesth. 2018;32(1):88–120. [CrossRef] [PubMed] [Google Scholar]
- Ferraris VA, Brown JR, Despotis GJ et al. 2011 update to the Society of Thoracic Surgeons and the Society Of Cardiovascular Anesthesiologists blood conservation clinical practice guidelines. Ann Thorac Surg. 2011;91(3):944–982. [CrossRef] [PubMed] [Google Scholar]
- Murphy GS, Hessel EA, Groom RC et al. Optimal perfusion during cardiopulmonary bypass: an evidence-based approach. Anesth Analg. 2009;108(5):1394–1417. [CrossRef] [PubMed] [Google Scholar]
- Gravlee GP. Cardiopulmonary bypass: principles and practice. 3rd ed. Philadelphia, PA: Lippincott Williams & Wilkins; 2008: 416-417. [Google Scholar]
- Hall JE. Guyton and hall textbook of medical physiology. 14th ed. Philadelphia, PA: Elsevier; 2020: 305–310. [Google Scholar]
- Sonoki T, Mushino T, Ueda Y et al., Use guidelines on red blood cell preparation based on scientific grounds (the revision third edition). Jpn J Transfusion Cell Therapy. 2024;70(6):579–596 (in Japanese). [Google Scholar]
- Hilberath J, Thomas ME, Smith T et al. Blood volume measurement by hemodilution: association with valve disease and re-evaluation of the Allen Formula. Perfusion. 2015;30(4):305–311. [Google Scholar]
- Hasegawa T, Iba Y, Naraoka S et al. Improvement of predicted hematocrit values after the initiation of cardiopulmonary bypass in cardiovascular surgery. J Artif Organs. 2021;25:1–8. [Google Scholar]
- Trowbridge C, Stammers A, Klayman M, Brindisi N. A novel calculation to estimate blood volume and hematocrit during bypass. J Extra Corpor Technol. 2008;40(1):61–64. [Google Scholar]
- Muraki R, Hiraoka A, Nagata K et al. Novel method for estimating the total blood volume: the importance of adjustment using the ideal body weight and age for the accurate prediction of haemodilution during cardiopulmonary bypass. Interact Cardiovasc Thorac Surg. 2018;27(6):802–807. [Google Scholar]
- Erpicum M, Dardenne N, Hans G, Larbuisson R, Defraigne J. Prediction of the post-dilution hematocrit during cardiopulmonary bypass. Are new formulas needed? Perfusion. 2016;31(6):458–464. [Google Scholar]
- Hibiya M, Kamei T, Kubota S et al. Study profile of the perfusion registry in Japan. Jpn J Extra Corpor Technol. 2018;45(1):1–7. [Google Scholar]
- Du Bois D, Du Bois EF. A formula to estimate the approximate surface area if height and weight be known. Arch Int Med. 1916;17(6):863–871. [Google Scholar]
- Japan Society for the Study of Obesity. Guidelines for the management of obesity disease 2022. Tokyo: Life Science Publishing; 2022: 1–7 (in Japanese). [Google Scholar]
- Shin DA, Lee JC, Shin H, Cho YJ, Kim HC. Point-of-care testing of plasma free hemoglobin and hematocrit for mechanical circulatory support. Sci Rep. 2021;11(1):3788. [Google Scholar]
- Maharana K, Mondal S, Nemade B. A review: Data pre-processing and data augmentation techniques. Global Transit Proc. 2022;3(1):91–99. [Google Scholar]
- Hancock JT, Khoshgoftaar TM. Survey on categorical data for neural networks. J Big Data. 2020;7:28. [CrossRef] [Google Scholar]
- Guyon I, Elisseeff A. An introduction to variable and feature selection. J Mach Learn Res. 2003;3:1157–1182. [Google Scholar]
- Jolliffe IT, Cadima J. Principal component analysis: a review and recent developments. Philos Trans Royal Soc A: Math, Phys Eng Sci. 2016;374(2065):20150202. [Google Scholar]
- Marquardt DW. An algorithm for least-squares estimation of nonlinear parameters. J Soc Indust Appl Math. 2013;11(2):431–441. [Google Scholar]
- Riedmiller M, Braun H. A direct adaptive method for faster backpropagation learning: the RPROP algorithm. In: IEEE Int Conf Neural Netw; 1993;1:586–591. [Google Scholar]
- Hoerl AE, Kennard RW. Ridge regression: biased estimation for nonorthogonal problems. Technometrics. 1970;12(1):55–67. [CrossRef] [Google Scholar]
- Bland JM, Altman DG. Comparing methods of measurement: why plotting difference against standard method is misleading, Lancet, 1995;346(8982):1085–1087. [Google Scholar]
- Bland JM, Altman DG. Measuring agreement in method comparison studies. Stat Methods Med Res. 1999;8:135–160. [Google Scholar]
Cite this article as: Hirano H, Takahashi S, Kamei T & Hibiya M. Estimation of hemoglobin concentration at the initiation of cardiopulmonary bypass using support vector regression. J Extra Corpor Technol 2026, 58, 128–138. https://doi.org/10.1051/ject/2025071.
All Tables
Clinical characteristics/Baseline clinical characteristics of the study population.
All Figures
|
Figure 1 Analysis flowchart. |
| In the text | |
|
Figure 2 Cumulative explained variance. Principal components (PCs) are added sequentially from PC1 to PC17 (left to right); 90% cumulative explained variance is achieved with the first 17 PCs. |
| In the text | |
|
Figure 3 Weight of principal component analysis. |
| In the text | |
|
Figure 4 Correlation between measured HbCPB and estimated HbCPB: (a) HbCPB was estimated based on GLM, (b) that based on SVR, (c) that based on MLP, (d) that calculated based on reference [11], and (e) that based on equation (6). |
| In the text | |
|
Figure 5 Bland–Altman analysis between measured HbCPB and estimated HbCPB: (a) estimated HbCPB was estimated based on GLM, (b) that based on SVR, (c) that based on MLP, (d) that calculated based on reference [11], and (e) that based on equation (6). |
| In the text | |
Current usage metrics show cumulative count of Article Views (full-text article views including HTML views, PDF and ePub downloads, according to the available data) and Abstracts Views on Vision4Press platform.
Data correspond to usage on the plateform after 2015. The current usage metrics is available 48-96 hours after online publication and is updated daily on week days.
Initial download of the metrics may take a while.