Figure 2
Download original image
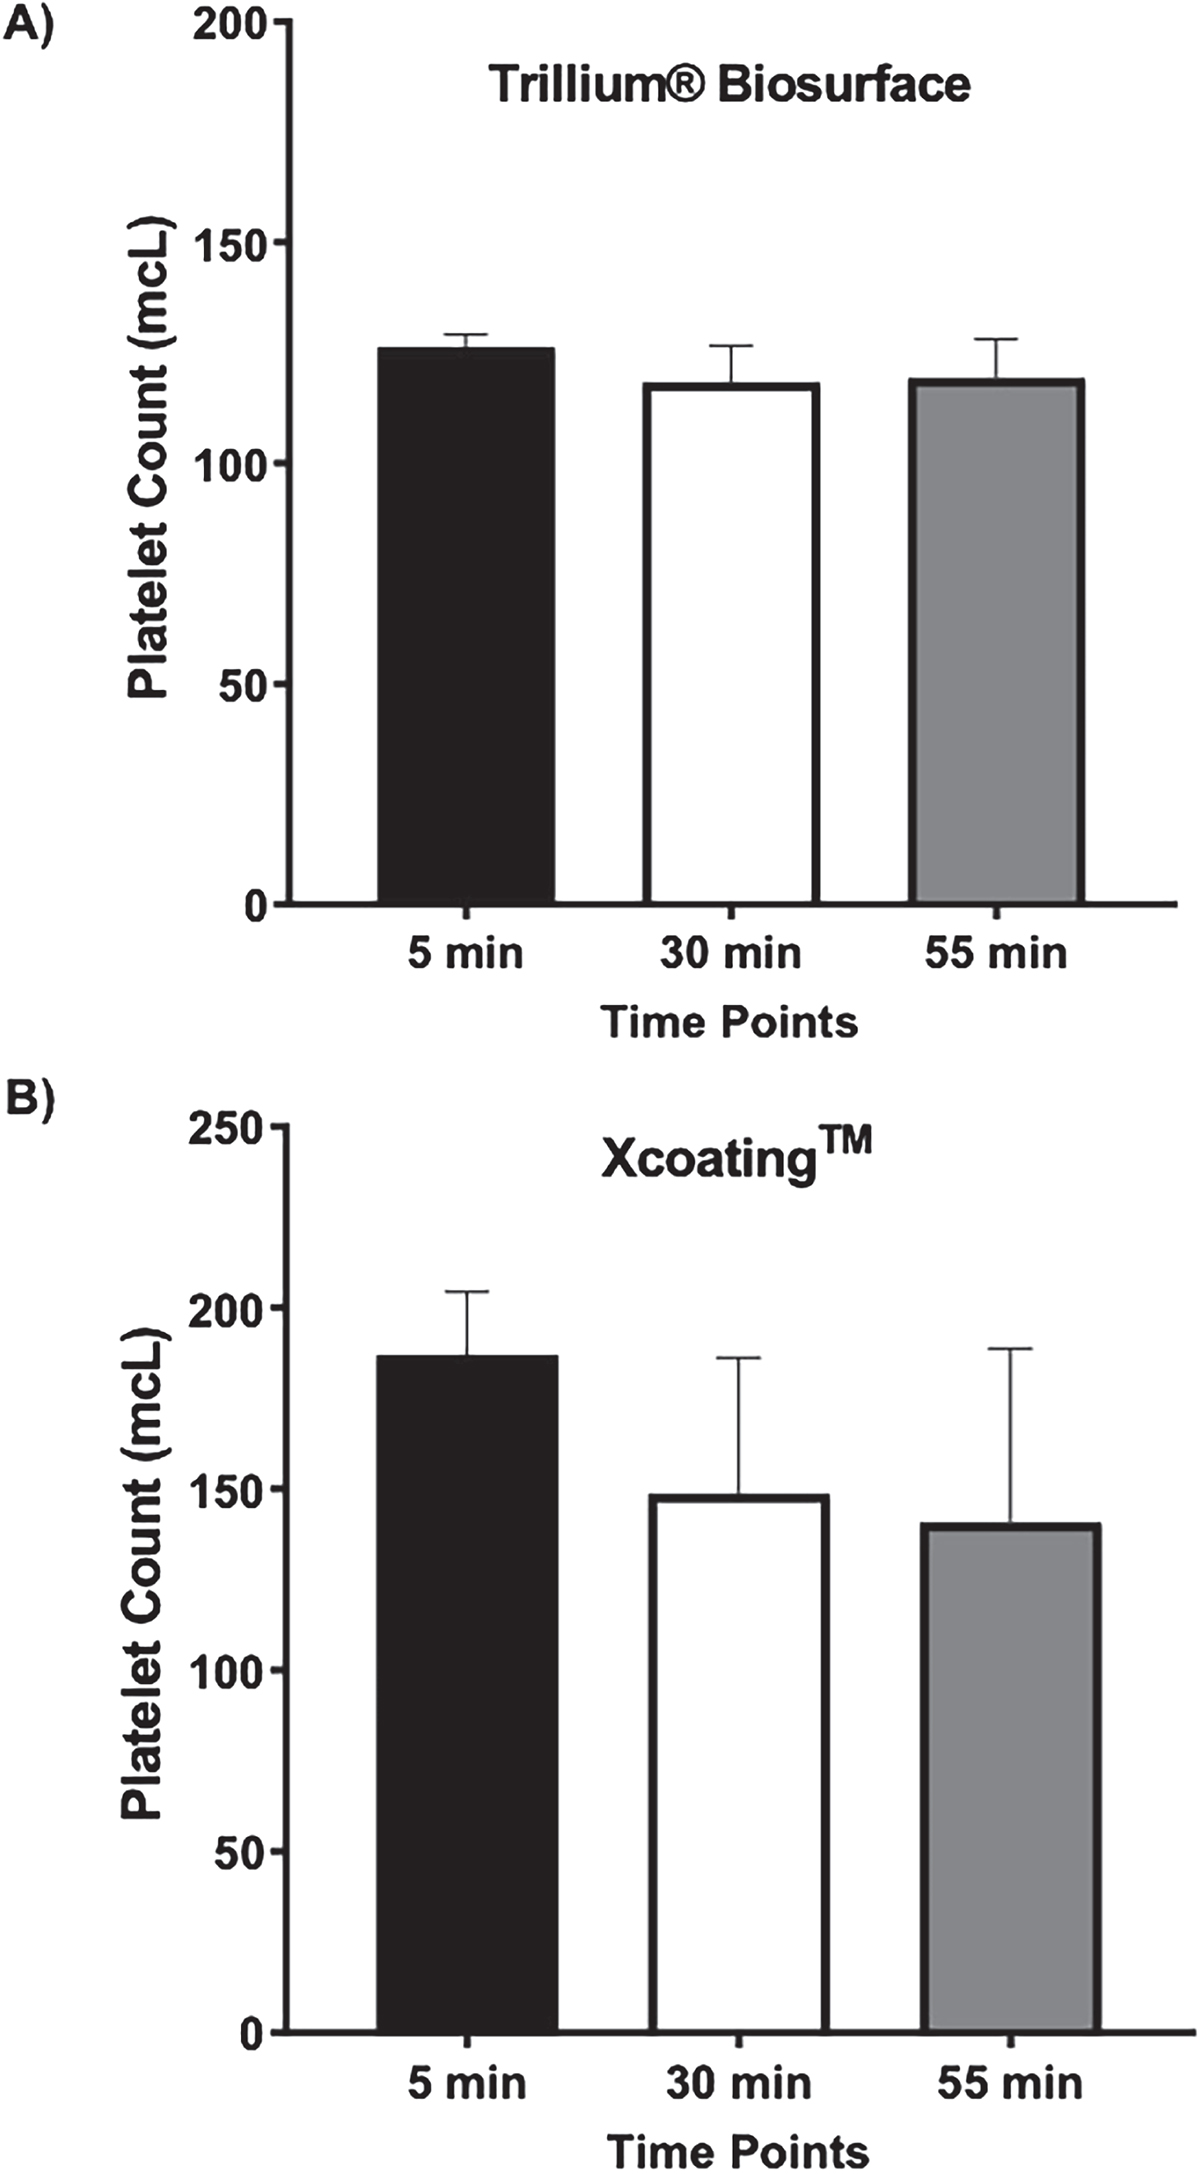
Quantification of Platelet counts in circulated bovine blood. (A) Bar graph presentation of platelet counts at different time points of bovine blood circulation using Trillium® Biosurface circuit. Data presents the average of five technical replicates using the same blood samples at 5 min, 30 min, and 55 min with no significant changes between time points. (B) Bar graph presentation of platelet counts at different time points of bovine blood circulation using XcoatingTM circuit. Data presents the average of five technical replicates using the same blood samples at 5 min, 30 min, and 55 min with no significant changes between time points. (Mean ± SD, P < 0.05, five technical replicates).
Current usage metrics show cumulative count of Article Views (full-text article views including HTML views, PDF and ePub downloads, according to the available data) and Abstracts Views on Vision4Press platform.
Data correspond to usage on the plateform after 2015. The current usage metrics is available 48-96 hours after online publication and is updated daily on week days.
Initial download of the metrics may take a while.