Figure 1
Download original image
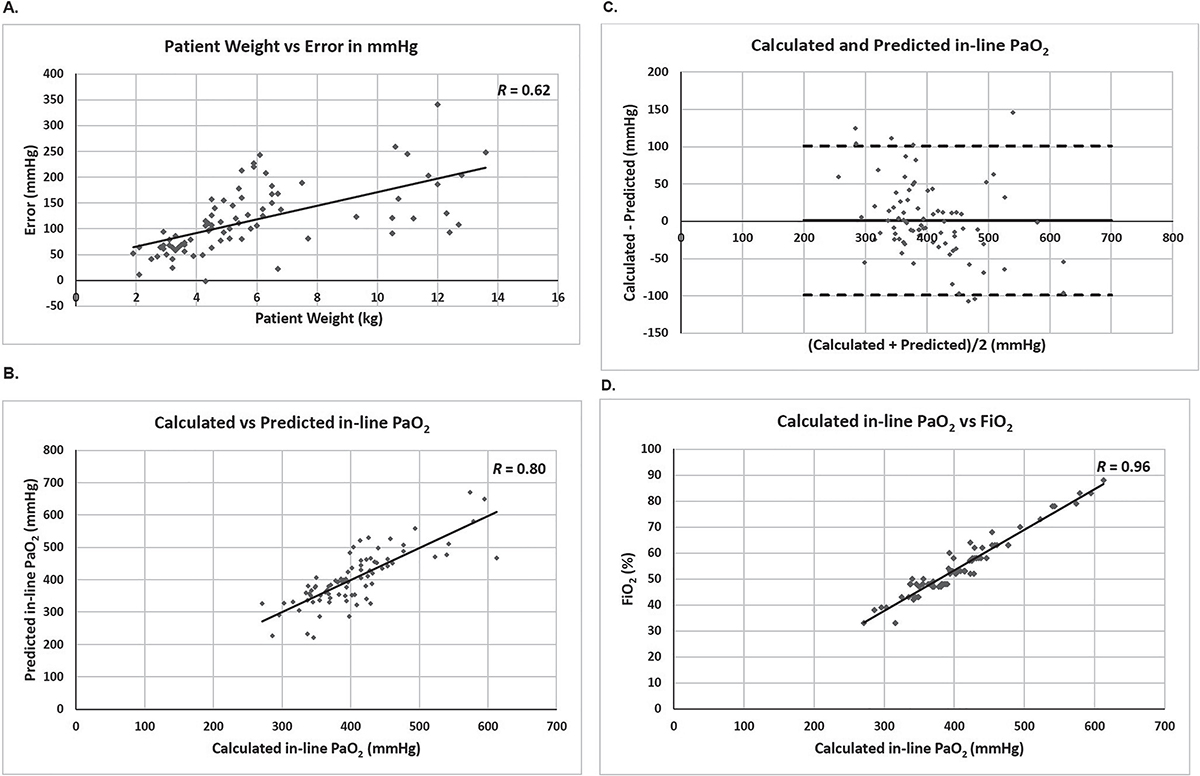
The error in the calculated in-line PaO2 of Quantum System at the 1st blood gas series has a strong correlation with the patient weight, which allows to derive a formula to compute the predicted in-line PaO2. (A) A scattered XY plot was drawn for patient weight (X-axis) and error in mmHg of the 1st blood gas series (Y-axis). The data was fitted into a linear regression line, showing a strong correlation. R value is shown in the upper right corner. (B) A scattered XY plot was drawn for the calculated in-line PaO2 of Quantum System (X-axis) and predicted in-line PaO2 computed with our formula (Y-axis). The data was fitted into a linear regression line, showing a very strong correlation. R value is shown in the upper right corner. (C) Bland-Altman analysis of the calculated and predicted in-line PaO2 shows strong agreement with a bias of 1 mmHg (bold solid line) and LOA of 101 and −99 mmHg (bold dashed lines). The X-axis represents the average of the calculated and predicted in-line PaO2, while the Y-axis represents the difference between the calculated and predicted in-line PaO2. (D) A scattered XY plot was drawn for the calculated in-line PaO2 (X-axis) and FiO2 (Y-axis) of Quantum System. The data was fitted into a linear regression line, showing a very strong correlation. R value is shown in the upper right corner.
Current usage metrics show cumulative count of Article Views (full-text article views including HTML views, PDF and ePub downloads, according to the available data) and Abstracts Views on Vision4Press platform.
Data correspond to usage on the plateform after 2015. The current usage metrics is available 48-96 hours after online publication and is updated daily on week days.
Initial download of the metrics may take a while.