Figure 2
Download original image
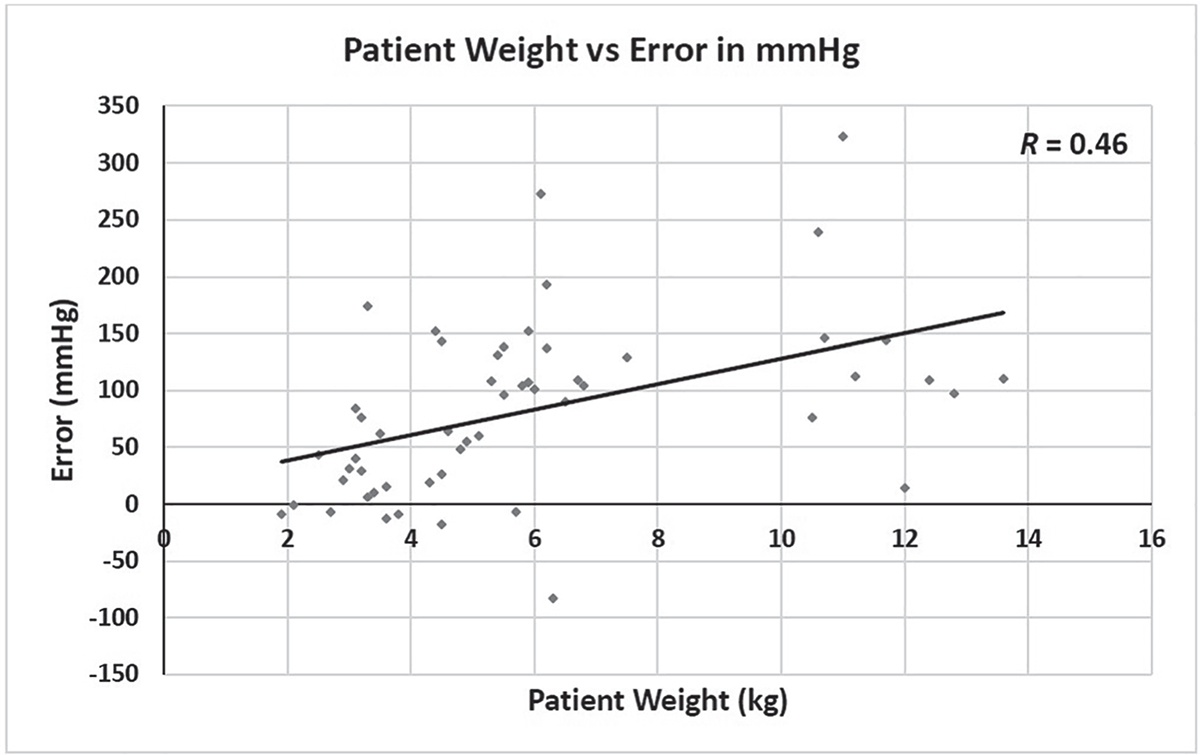
The calculated in-line PaO2 of Quantum System drifts upward during the rewarming and rewarmed periods, showing a moderate correlation to patient weight. A scattered XY plot was drawn for patient weight (X-axis) and combined error in mmHg of the 4th and 5th blood gas series (Y-axis). The data was fitted into a linear regression line, showing a moderate correlation. R value is shown in the upper right corner.
Current usage metrics show cumulative count of Article Views (full-text article views including HTML views, PDF and ePub downloads, according to the available data) and Abstracts Views on Vision4Press platform.
Data correspond to usage on the plateform after 2015. The current usage metrics is available 48-96 hours after online publication and is updated daily on week days.
Initial download of the metrics may take a while.